Led UX/UI for VMware’s white-label virtual lab platform, designing a web-based experience that supported searchable, ranked lab courses and structured learning paths.
Integrated gamification elements — including ratings, reviews, leaderboards, completion metrics, and comparative performance scoring — to drive engagement and course completion. The system was built for enterprise white-label deployment, allowing clients to deliver branded virtual learning environments at scale.
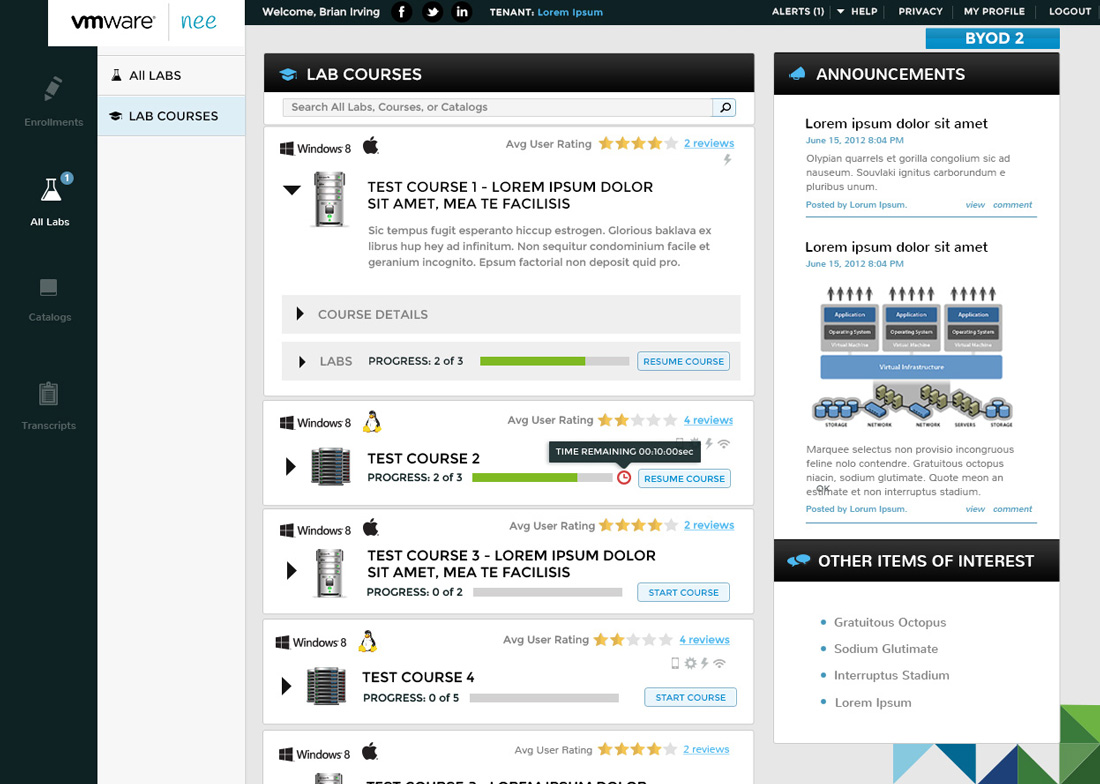
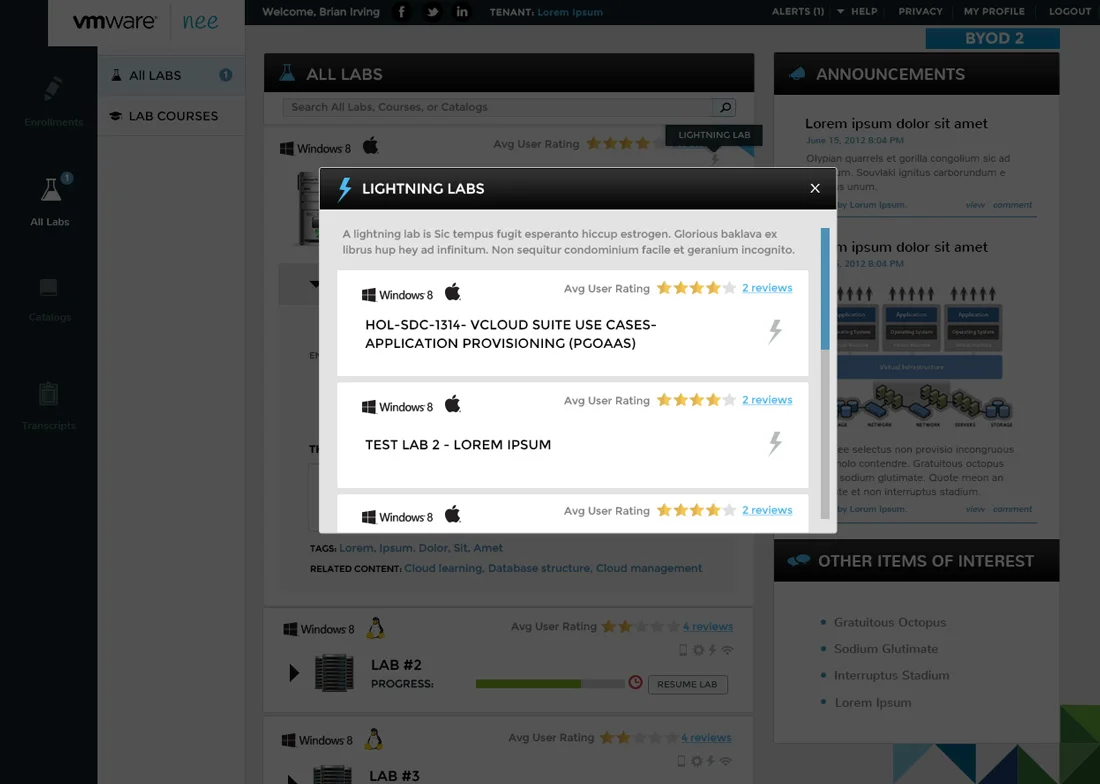
Course Selection
Discoverability & Structured Learning
Enabled efficient lab and course discovery through categorization, filtering, difficulty ranking, estimated completion time, and “most completed” indicators — helping users quickly select experiences aligned to their skill level and time constraints.
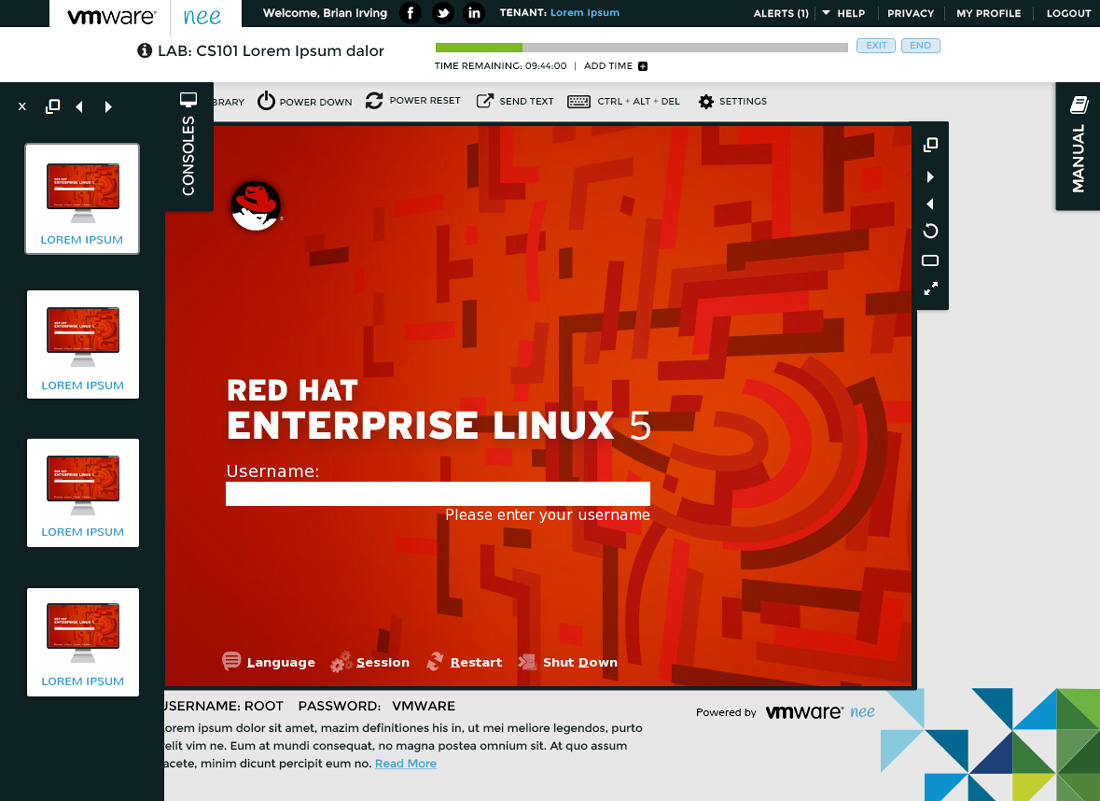
The Console
Virtual Console & Environment Control
Simplified complex lab interactions by improving core console usability, including launching labs, switching environments, adjusting layouts, and managing session workflows within a technically dense interface.
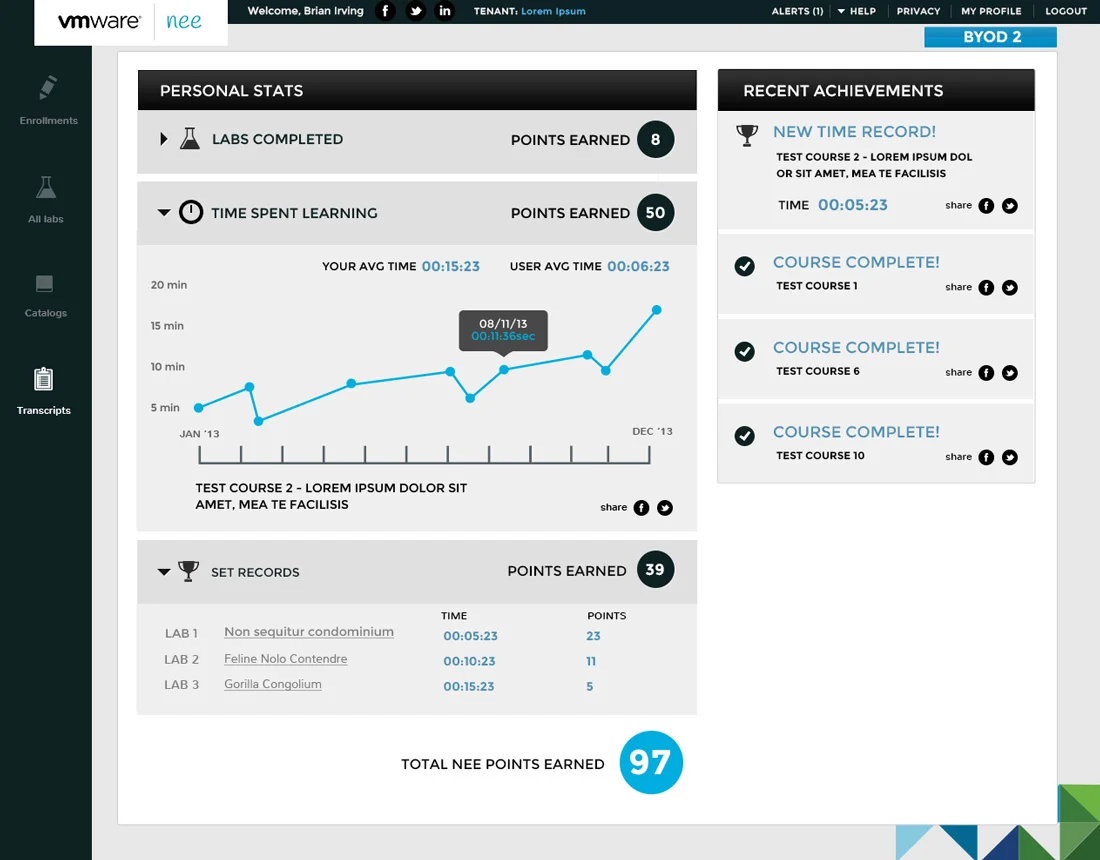
Couse Performance
Gamification & Performance Visibility
Introduced ratings, peer reviews, leaderboards, completion tracking, and comparative performance scoring to drive engagement, motivation, and measurable course progression.

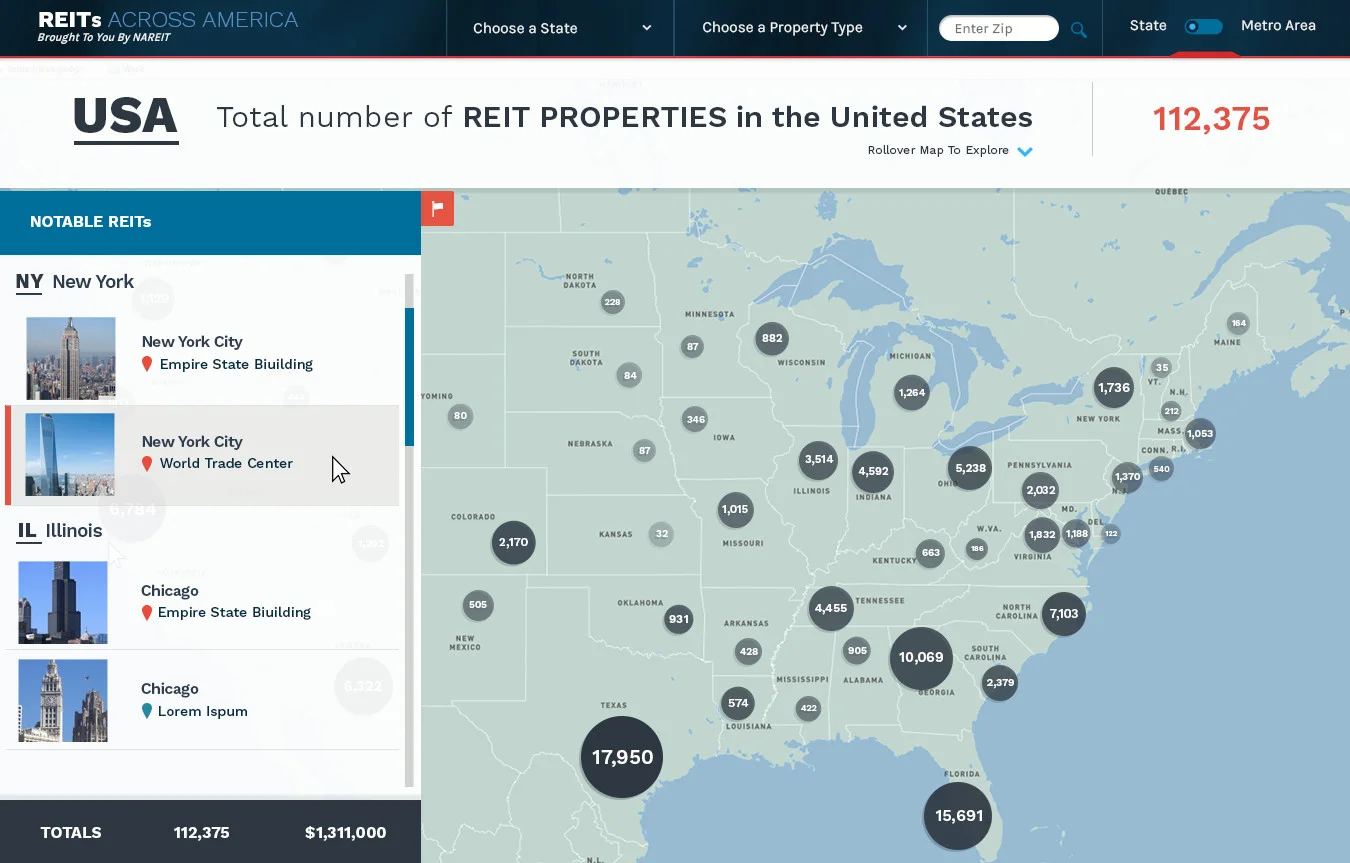
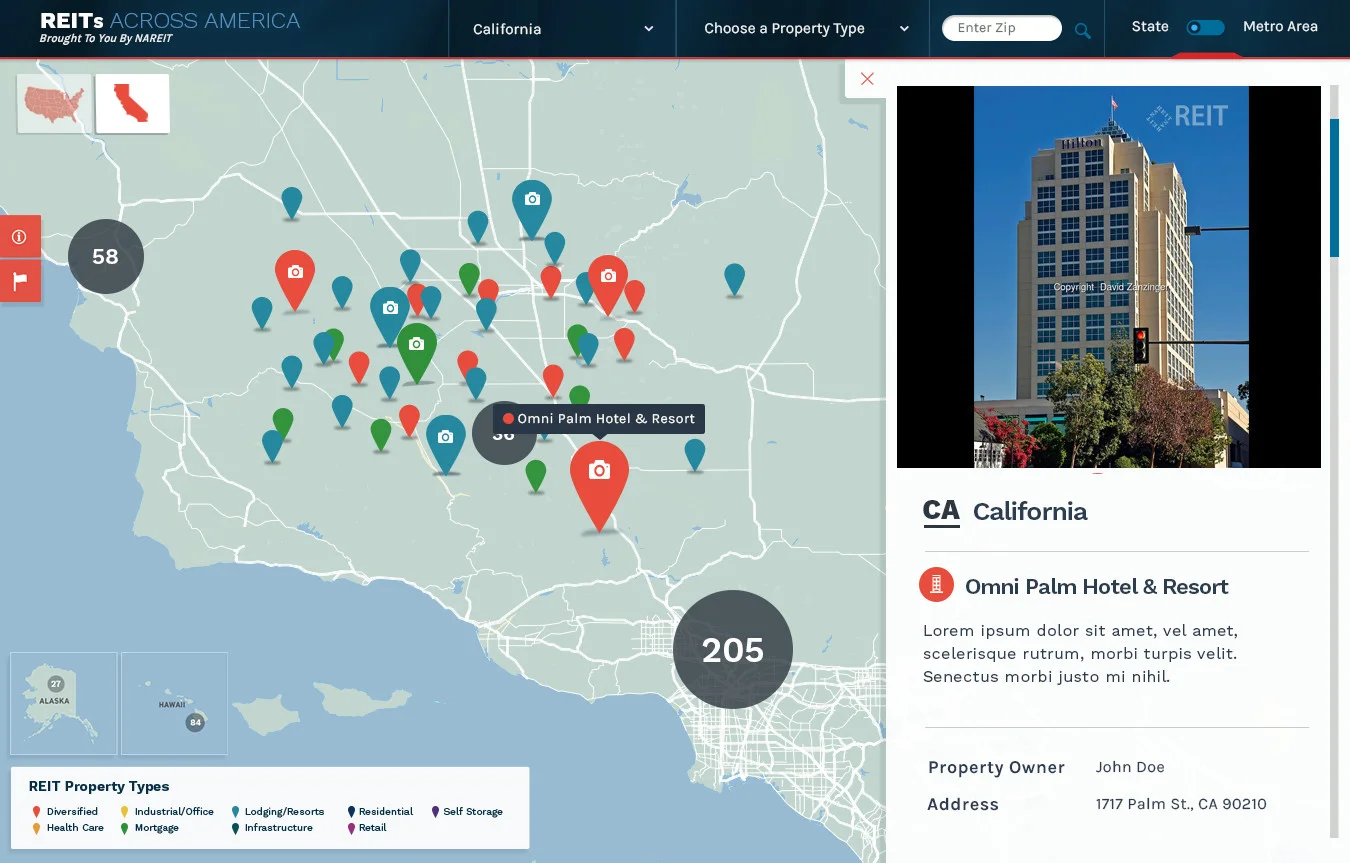
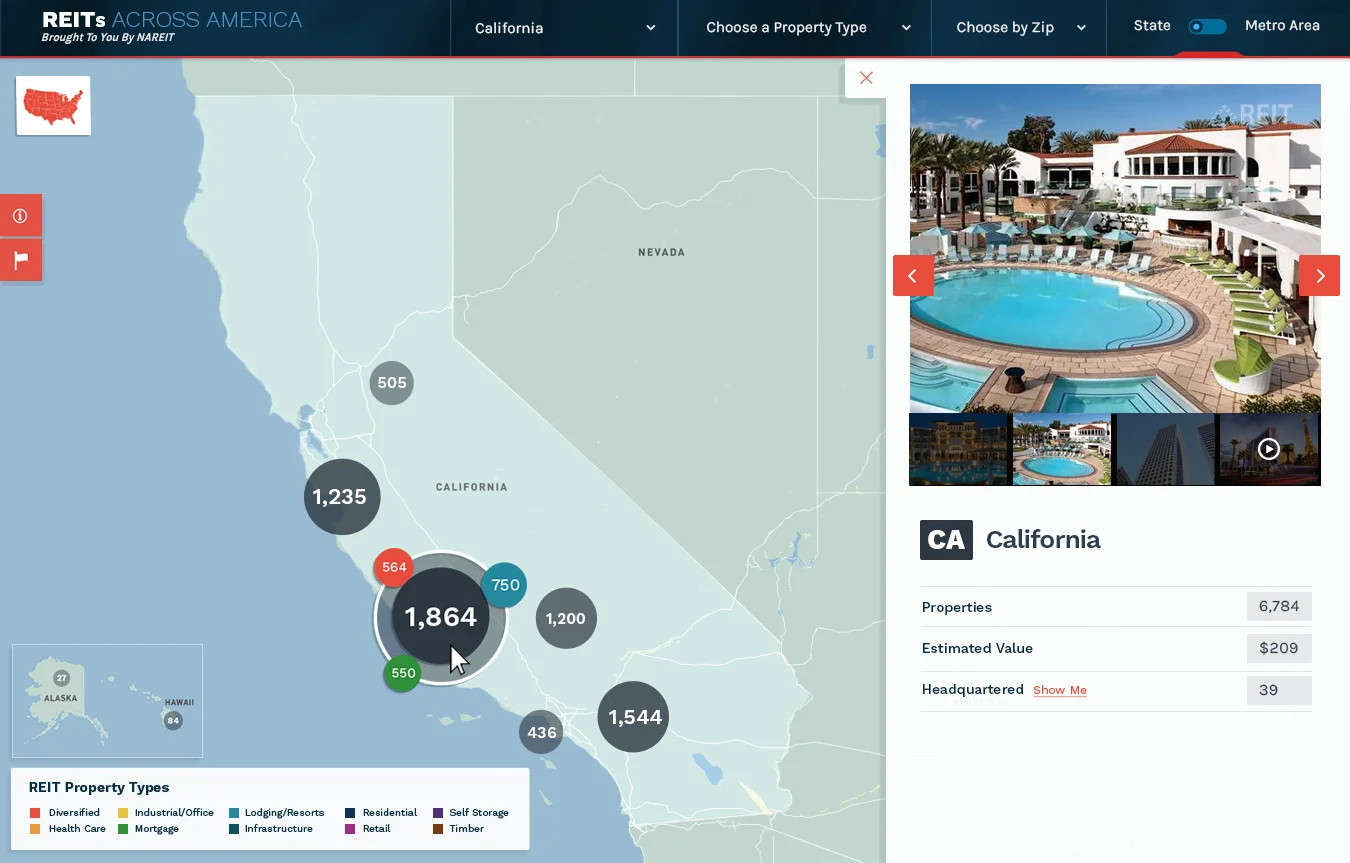
Nareit needed a more intuitive way for users to search and explore REIT-owned properties across the United States. The existing experience was content-heavy and difficult to navigate. I redesigned it into an interactive, map-based platform that made complex property data digestible, searchable, and engaging without overwhelming the user.
Personas

Name: Sarah Mitchell
Age: 34
Role: Real Estate Investment Analyst at a mid-sized asset management firm
Location: Chicago, IL
Why She Uses Nareit
Sarah uses Nareit to understand how REIT portfolios are distributed across the U.S., support investment theses, and prepare insights for portfolio managers. She needs information that is credible, structured, and easy to interpret quickly.
Goals
Evaluate REIT portfolio exposure by geography and property type
Identify trends across sectors (industrial, retail, healthcare, etc.)
Quickly compare property density and concentration by region
Access reliable, consolidated industry data
Frustrations
Property data spread across multiple sources
Dense, hard-to-scan reports
Static lists that lack geographic context
Difficulty visualizing scale across states or regions
Needs
A searchable, map-based interface
Quick filtering by state or region
Clear property summaries with access to deeper details
Responsive access on desktop and tablet during meetings

Responsive,
Coss-Device Experience
The platform was designed to function seamlessly across desktop and mobile, ensuring accessibility for investors and researchers on any device.
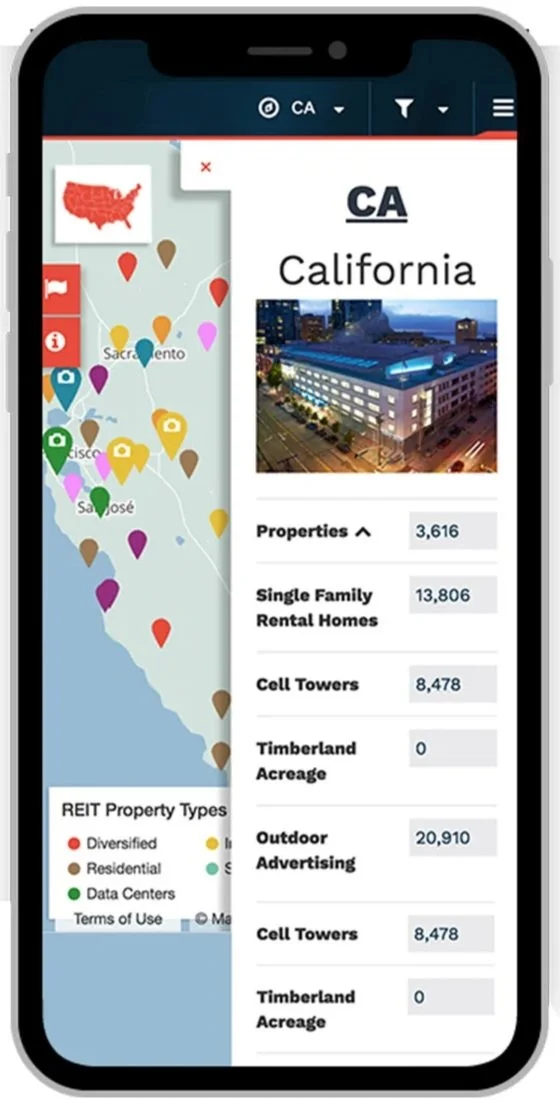
Dual Search &
Browse Functionality
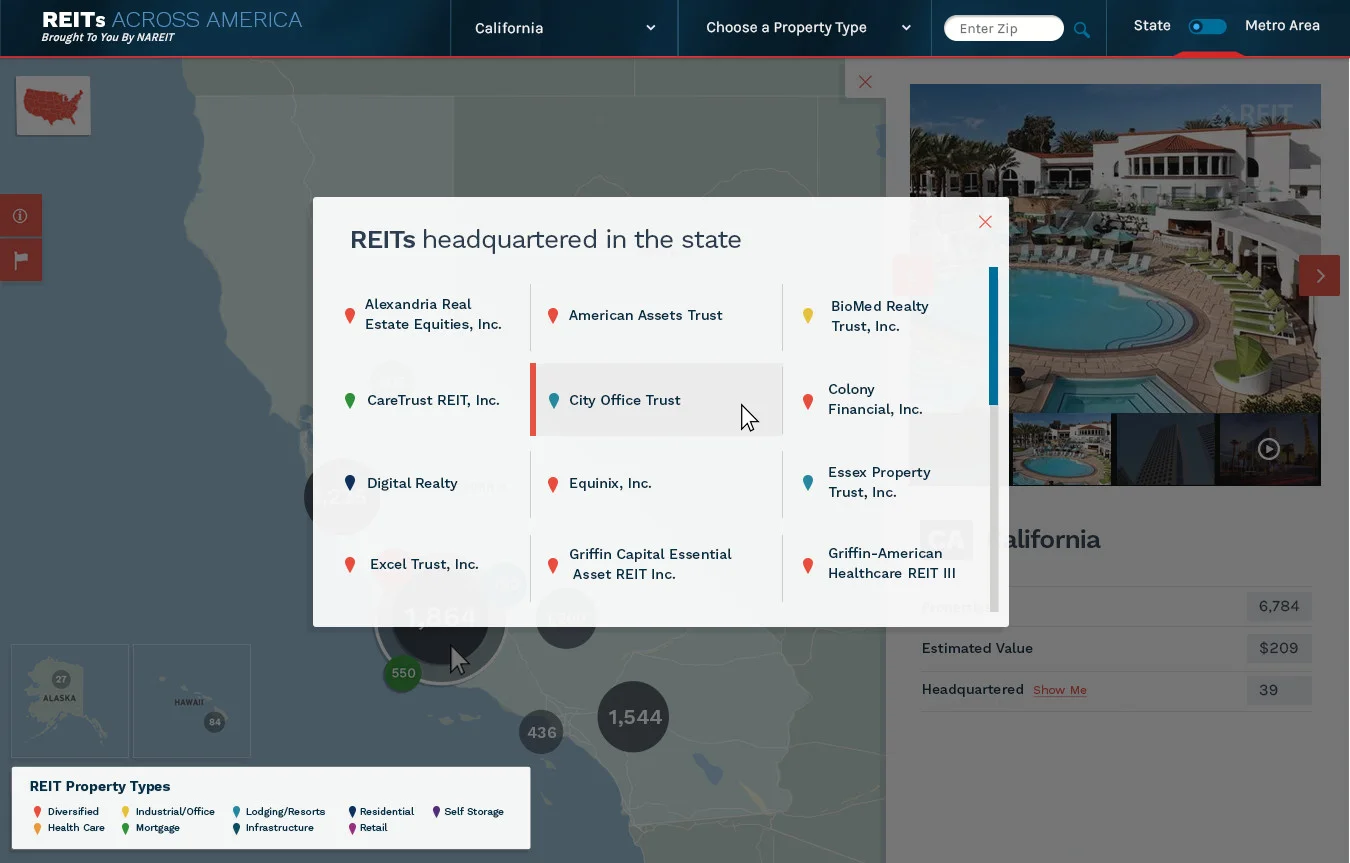
Users can explore properties visually via the interactive map or locate specific assets using a structured search bar.
Progressive Map Exploration
As users zoom into states and regions, map pins dynamically reveal deeper levels of property data, supporting intuitive geographic discovery.